Effective Ways to Find the Interquartile Range in 2025: A Smart Guide to Data Analysis
Understanding the Interquartile Range
The interquartile range (IQR) is a crucial measure of variability that helps in understanding the spread of data. Specifically, it represents the range of the middle fifty percent of a data set, effectively highlighting the central tendency and excluding outliers. To determine the IQR, we need to calculate the first quartile (Q1) and the third quartile (Q3), which divides the data into four equal parts. The formula for IQR is simple: IQR = Q3 – Q1. This calculation is essential in data analysis, providing insights into the data distribution and assisting in outlier detection actively. For those engaged in statistical analysis, being adept at finding the IQR is foundational for interpreting data accurately.
What Are Quartiles?
Quartiles divide a ranked data set into four equal parts. The first quartile (Q1) marks the 25th percentile, while the third quartile (Q3) denotes the 75th percentile. The difference between Q1 and Q3 gives you the IQR, which represents the central data spread. Calculating quartiles involves sorting the data and identifying the median values of the lower and upper halves. Understanding quartiles is not merely an academic exercise; it reflects in descriptive statistics and visual data representations, particularly fascinating box plots that graphically summarize data with its five-number summary.
The Importance of IQR in Outlier Detection
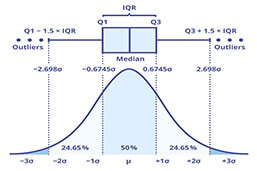
Using the IQR in data analysis extends to outlier detection, which is crucial for ensuring the reliability of data insights. Outliers can skew various statistical models and lead to incorrect conclusions. Typically, an observation is deemed an outlier if it lies below Q1 – 1.5*IQR or above Q3 + 1.5*IQR. This IQR-based rule offers a systematic method for filtering out anomalous data, thereby enhancing data quality for robust conclusions in fields like experimental data analysis and quantitative research.
Steps to Calculate the Interquartile Range
Calculating the IQR involves several straightforward steps. Whether you’re dealing with sample data or population data, the process remains largely the same. It lays the foundation for understanding statistical outcomes and data interpretation. This method runs parallel to statistical methods that focus on data variability.
Step-by-Step Guide to Calculate Quartiles
1. **Sort the Data**: Arrange your data set in ascending order. This is essential for accurate identification of quartiles.
2. **Determine Q1 and Q3**: Find the first and third quartiles.
3. **Calculate IQR**: Subtract Q1 from Q3 to get the IQR. This figure represents the spread between the upper and lower quartiles.
4. **Identify Outliers**: Using the IQR, you can check for any outliers that lie well outside the calculated range.
This systematic approach ensures that your analysis remains rigorous and precise, particularly valuable in exploratory data analysis, where accurate data grouping can provide pivotal insights.
Using Box-and-Whisker Plots to Visualize IQR
A box-and-whisker plot is an excellent tool to visualize the interquartile range, offering a compact representation of the data distribution. This type of plot displays the median, quartiles, and potential outliers in an intuitive way. The box represents the IQR, while the ‘whiskers’ indicate variability outside the upper and lower quartiles. By interpreting these aspects, one can quickly assess the central tendency and the spread of data, making it a vital component in both descriptive statistics and presentations of statistical data.
Applications of the Interquartile Range in Data Analysis
The IQR is not just a theoretical concept; it has practical applications in various fields, enhancing analysis in large data sets. By understanding the use of IQR, you can apply it effectively to real-world scenarios in research analysis or everyday data-related tasks. It serves as a guide in evaluating quality measures, where proper analysis determines the effectiveness of your data collection methods.
Research Methodology Enhancement
In research methodology, employing the interquartile range can significantly impact data reliability and result interpretation. By focusing on the IQR, researchers can mitigate the influence of outliers, leading to more substantial statistical evidence. This method supports credible analysis in any hypothesis testing framework and strengthens data validation frameworks, ultimately improving the quality of results.
Comparison Between Sample and Population Data
Comparing sample data and population data can elucidate various insights using the IQR approach. In public health, for instance, epidemiologists can utilize the IQR to determine whether behaviors like smoking spawn outliers in population health metrics. This evaluation proves invaluable for indicating risk and can shape interventions significantly.
Key Takeaways
- The interquartile range (IQR) serves as a vital measure of variability, illuminating the center of a data set.
- Calculating Q1 and Q3 is fundamental for reliable IQR determination, which is pivotal in outlier detection.
- Box-and-whisker plots provide meaningful visual representations of IQR, enhancing comprehendibility in data analysis.
- Understanding and applying IQR is crucial in various domains, ensuring rigorous, evidence-based results in research analysis.
FAQ
1. How do you determine quartiles in a data set?
To determine quartiles, first sort your data in ascending order. The first quartile (Q1) is the median of the lower half of the data, while the third quartile (Q3) is the median of the upper half. This methodology is fundamental and enriching for any statistical analysis and greatly contributes to the accuracy of IQR calculations.
2. Why is the IQR preferred for outlier detection over other measures?
The IQR is particularly robust against outliers since it only considers the spread in the central percentage of the data. This reliability means that unlike the overall range, which can be influenced heavily by extreme values, the IQR provides a clearer picture of the data distribution without these skewed influences.
3. How does skewness in data affect calculations of IQR?
Skewed data may not affect the IQR itself since the measurement focusses on the middle fifty percent of data, however, understanding skewness is crucial for interpreting results. If the data skew is quite pronounced, other measures of central tendency such as mean and median may diverge significantly, influencing physical interpretations of results.
4. Can you use IQR for non-continuous data?
Yes, the interquartile range can be applied to non-continuous data. While ordinal and categorical data may not have an intrinsic order in the same way continuous data does, it can still be sorted, allowing for quartile determine and creating a useful measure of dispersion in certain circumstances.
5. What role does variance play in understanding the IQR?
Variance measures how far a set of numbers is spread out from their average value. While IQR focuses solely on the spread within the interquartile range, understanding the relationship between variance and IQR allows for a fuller picture of data variability. By analyzing both together, researchers can gain insights into data reliability and integrity.
6. How does the IQR correlate with central tendency?
The IQR assists in assessing the stability of the central tendency measures, particularly as it informs about the data spread. In a symmetrical distribution, like the normal distribution often utilized in statistical models, the mean and median are similar, making the IQR a helpful complement in examining skewness and providing insight into randomness.
7. How can I visualize the IQR effectively?
Utilizing box-and-whisker plots is one of the best ways to visualize IQR as they provide a clear illustration of the quartiles and medians, alongside the potential outliers in the data set. This diagrammatic representation enhances comprehension of the range of central values and distribution characteristics in the analyzed data.
For a comprehensive guide on determining the interquartile range, refer to the accompanying illustrations:  and
and 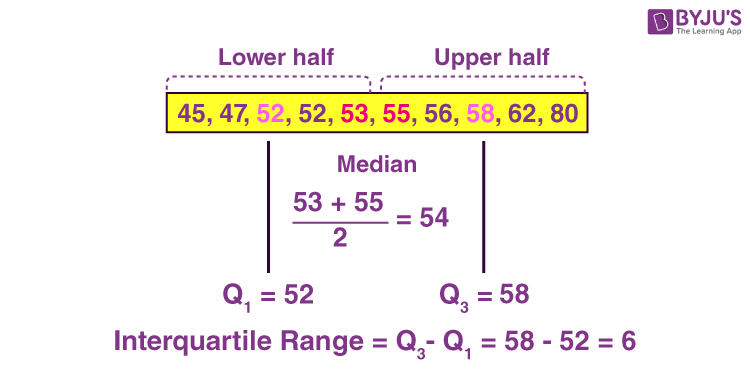 .
.