Effective Ways to Find Confidence Interval in 2025
Understanding Confidence Intervals and Their Importance
In the realm of statistical analysis, a confidence interval provides a range of values that likely contains the true population parameter derived from a sample statistic. It plays a crucial role in inferential statistics, allowing researchers to make educated assumptions about a population based on sample data. Essentially, a confidence interval, defined by its margin of error and confidence level, offers a measure of reliability in estimates, helping to quantify uncertainty in observations and results.
The Concept of Margin of Error
The margin of error is a critical element when constructing confidence intervals. It indicates the range within which the true population parameter is expected to lie. To compute the margin of error, one typically multiplies the standard deviation of the sample by a critical value, which is derived from the relevant statistical distribution—z-score for large samples or t-score for smaller ones. For instance, if a research study finds a sample mean of 50 with a standard deviation of 10, you can calculate the margin of error at a 95% confidence level, yielding a range of values indicating where the true mean likely falls.
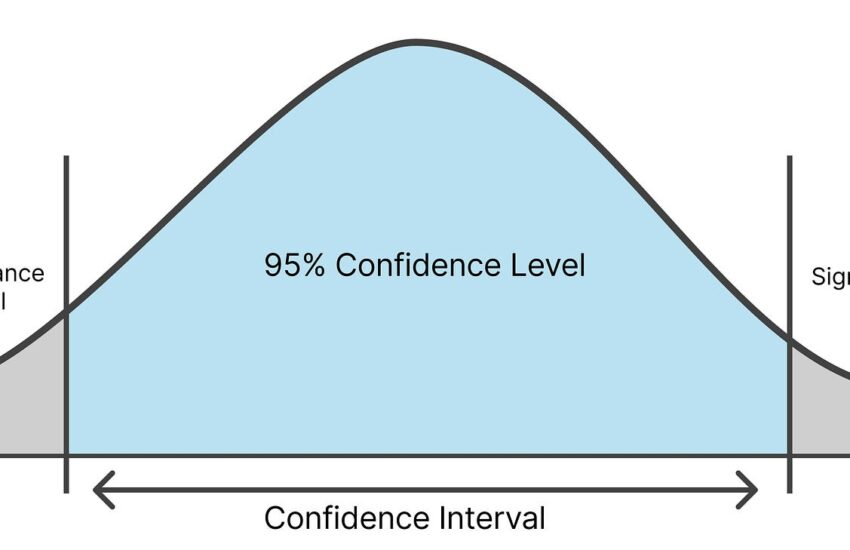
Choosing the Right Confidence Level
The choice of confidence level (commonly 90%, 95%, or 99%) directly affects the interval’s width—the higher the confidence level, the larger the interval and the more uncertainty accounted. When conducting hypothesis testing or analyzing survey results, researchers must balance precision and reliability by selecting an appropriate confidence level based on the objectives of the study and available data.
Interpreting Confidence Intervals
Interpreting confidence intervals is essential for deriving meaningful conclusions from data. A confidence interval provides non-binary insights into statistical significance, indicating not just whether the null hypothesis holds but providing a range for plausible values of the population parameter. For example, if a 95% confidence interval for a population mean is (45, 55), there is a high degree of belief that the actual mean lies within this interval, emphasizing the need for adequately constructed confidence bounds.
Techniques for Calculating Confidence Intervals
Various techniques exist for calculating confidence intervals, each tailored to specific scenarios and types of data. This section will delve into some essential methods, including normal distribution approaches and t-distribution methodologies.
Using the Normal Distribution
When data approaches normality, the central limit theorem presents a convenient framework for calculating confidence intervals based on the normal distribution. To construct a normal confidence interval for a population mean, you can use the formula:
CI = \(\bar{x} \pm z \times \frac{\sigma}{\sqrt{n}}\) where \(\bar{x}\) is the sample mean, \(z\) is the z-score for the desired confidence level, \(\sigma\) is the population standard deviation, and \(n\) is the sample size. This method is particularly effective for large sample sizes (n > 30).
Employing T-Distribution for Smaller Samples
For small sample sizes (n ≤ 30), the t-distribution is more appropriate due to its heavier tails, which account for greater variability. The formula used is similar but replaces the z-score with the t-score:
CI = \(\bar{x} \pm t \times \frac{s}{\sqrt{n}}\) where \(s\) is the sample standard deviation. This adjustment ensures more accurate interval estimation when dealing with limited data, enabling researchers to maintain confidence in their parameter estimation.
Bootstrap Methods for Confidence Intervals
Bootstrap methods exemplify a powerful technique for determining confidence intervals without relying on specific distribution assumptions. This resampling method involves repeatedly drawing samples from the observed data, computing the statistic of interest for each sample to create a distribution of the estimate. The confidence interval is then derived from the percentile of this empirical distribution, allowing for flexibility in complex data situations, making it ideal for empirical research and studies where traditional methods may fall short.
Applications of Confidence Intervals in Research
Well-constructed confidence intervals serve as a foundation in a multitude of research fields, facilitating rigorous data analysis techniques and informing significant decisions. In this section, we explore practical applications across various domains.
Survey Results Interpretation
The interpretation of survey results is enhanced dramatically with confidence intervals. As researchers collect data from respondents, statistical software can assist in calculating confidence intervals for mean responses, ensuring robust insights for decision-making processes. For instance, when evaluating consumer satisfaction on a scale from 1 to 10, a confidence interval (3.5, 4.5) communicates the estimated average satisfaction level alongside associated uncertainty—a guideline for companies to refine products or services effectively.
Selection of Sample Size
Sample size determination is crucial to ensure adequate power in research studies. By knowing the desired margin of error and confidence level, researchers can utilize standard formulas to ascertain the minimum sample size required to achieve robust results. For example, smaller allowable margins of error necessitate larger samples to encompass population variations—an important consideration in both qualitative and quantitative studies.
Statistical Inference in Experimental Design
In the realm of experimental design, confidence intervals provide essential insights into the estimated effects of treatments or interventions. When analyzing the mean difference between two treatment groups, researchers can leverage confidence intervals to ascertain statistically significant outcomes by checking if the interval includes zero. A mean difference confidence interval that does not cross zero implies a statistically significant result, driving conclusions in clinical trials or controlled experiments.
Beyond Basics: Advanced Statistical Concepts
As researchers delve deeper into data-driven approaches, advanced statistics contribute to the robustness of confidence intervals. Knowing when to apply various statistical methodologies enhances the precision of results, as discussed below.
Bayesian Inference Approaches
Bayesian inference signifies a paradigm shift in understanding confidence and uncertainty. This method incorporates prior knowledge into the assessment of confidence intervals, updating beliefs based on observed data. Unlike classical methods that build confidence intervals strictly from the sample, Bayesian techniques permit the integration of prior distributions, ultimately framing a modernized understanding of parameters within a probabilistic context.
Understanding Variability and Data Interpretation
Grasping data variability is fundamental in choosing appropriate confidence levels and determining the structure of confidence intervals. Techniques such as variance analysis and understanding data representation assist researchers in interpreting results reliably, enhancing the overall understanding of the dataset and how it informs statistical conclusions.
Utilizing Statistical Software for Enhanced Analysis
Leveraging statistical software considerably streamlines the construction of confidence intervals. Software packages such as R, SPSS, or Stata provide built-in functions allowing quick execution of calculations for confidence intervals and automated methods for bootstrap and Bayesian approaches. This efficiency backs data-driven decision-making across industries, underscoring the crucial role of technology in modern data analysis techniques.
Key Takeaways
- Confidence intervals are essential tools for estimating population parameters and understanding variability.
- Margin of error and confidence levels are critical in constructing confidence intervals for robust statistical analysis.
- Bootstrap methods provide flexible approaches when traditional assumptions about the data are not met.
- Applications in survey research, sample size determination, and experimental design underscore their value across fields.
- Embracing advanced methodologies, like Bayesian inference, can greatly enhance confidence interval estimations.
FAQ
1. What is a confidence interval?
A confidence interval is a range of values used to estimate a population parameter based on sample data, providing insight into the reliability and validity of the estimate.
2. How do I calculate the margin of error?
The margin of error is calculated by multiplying the standard deviation by a critical value corresponding to your chosen confidence level. This indicates the extent to which your sample represents the population.
3. What factors affect confidence intervals?
Confidence intervals are affected by sample size, variability in data, confidence level, and the method used for their calculation, such as normal or t-distribution.
4. How can bootstrap methods be applied to confidence intervals?
Bootstrap methods involve resampling techniques that generate multiple estimates to form a distribution of the sample statistic, allowing for robust estimation of confidence intervals without relying on normality.
5. What is the difference between z-score and t-score in constructing confidence intervals?
The z-score is used for larger sample sizes reflecting normal distribution assumptions, while the t-score is utilized for smaller samples, accounting for additional variability.