How to Effectively Sum a Column in Excel to Enhance Your Data Analysis in 2025
Understanding how to sum values in a spreadsheet is a crucial skill for anyone working with Microsoft Excel. Whether you’re analyzing financial data for a project, compiling a report, or simply managing your personal bookkeeping tasks, mastering the ability to add numbers across a column in Excel will significantly enhance your data analysis capabilities. This guide provides practical tips and formulas for effectively using Excel to calculate totals in your worksheets.
Utilizing the Excel SUM Function
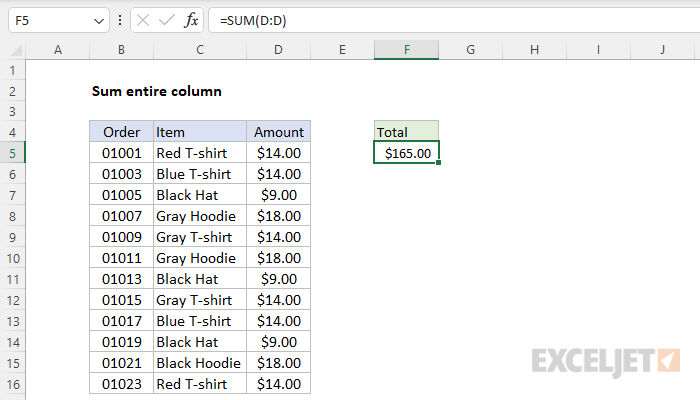
One of the most widely used features in Excel for adding values together is the SUM function. With just a simple formula, you can quickly calculate the total of a specified cell range. The basic syntax for the SUM function is straightforward: =SUM(range), where “range” refers to the specified cells you want to sum. For instance, if you need to add the values from cells A1 to A10, you would enter =SUM(A1:A10) in the formula bar. This method allows for quick data entry and efficient calculations.
Using AutoSum for Quick Calculations
Excel also offers a quick and efficient feature called AutoSum, which can be incredibly beneficial for users seeking a rapid way to calculate totals. To use AutoSum, simply select the empty cell immediately below the column of numbers you want to sum. Then, navigate to the Home tab, click on the AutoSum sign (∑) in the editing group, and press Enter. This action automatically creates the SUM formula, making it not only easy but also time-saving for frequent computations.
Integrating Other Formulas with SUM
You can enhance your data analysis with more complex functions by combining the SUM function with others like SUMIF or SUMPRODUCT. For example, the SUMIF function allows you to sum only those values that meet a specific criterion. The syntax for this function is =SUMIF(range, criteria, [sum_range]). This can be particularly useful in scenarios such as financial accounting where you only want the total of expenses in a particular category.
Automate Calculations with Executive Functions
If you regularly work with large amounts of numeric data, automating calculations can significantly improve your efficiency. Excel offers various executive functions like COUNT, AVERAGE, and MAX, all designed to provide quick analytics alongside your basic sum. By utilizing these functions in combination, you can generate comprehensive insights from your numerical data without manual counting.
Using Dynamic Ranges for Flexible Summing
When dealing with fluctuating data sets, dynamic ranges are essential for maintaining accurate calculations. By using the OFFSET and COUNTA functions together with the SUM function, you can create a dynamic range that adjusts as the data changes. For example, =SUM(OFFSET(A1,0,0,COUNTA(A:A),1)) allows you to sum all non-blank cells in column A—it automatically updates every time you add new data.
Creating a Worksheet for Enhanced Tracking
Organizing your data into distinct worksheets is another way to facilitate easier summing. By structuring related data into separate tabs, you can maintain clarity and focus, making it easier to track totals. Additionally, it simplifies referencing cells from different sheets. For instance, to sum data across multiple sheets, you would utilize the syntax =SUM(Sheet1:Sheet3!A1). This provides a more comprehensive approach to handling extensive datasets systematically.
Visualizing Data for Better Insights
Not only can summing values provide totals, but it also lays the groundwork for effective data visualization. By creating graphs or charts based on summed totals, you can more intuitively communicate your findings through visual mediums. For instance, incorporating a simple bar or pie chart can allow stakeholders to see trends and patterns without sifting through raw data.
Creating Charts and Reports
Once you have summed your data, consider using Excel’s chart functions to visualize your results. Select your totals and navigate to the “Insert” menu to showcase your data in various formats like line graphs or pie charts. This not only helps present your data effectively but also assists in drawing attention to critical insights and trends that may not be apparent through numbers alone.
Integrating Pivot Tables for Advanced Analysis
Pivot tables are a powerful tool in Excel that allow users to summarize extensive data in an interactive way. By dragging various field values into a pivot table, users can create dynamic views, aggregate information, and swiftly analyze their data’s central aspects such as totals and averages. This feature can be an excellent alternative for those looking to execute more complex data analyses beyond simple column summations.
Conclusion
Mastering the art of summing values in Excel is indispensable for anyone involved in data management, project planning, or business analytics. Along the path to harnessing these skills, familiarizing yourself with functions like SUM, AutoSum, and advanced techniques such as dynamic ranges or pivot tables can boost both your productivity and data analysis accuracy in 2025. Through effective utilization of Excel’s numerous features, you can elevate your capabilities in handling numerical data, enabling informed and swift decision-making.
FAQ
1. What is the SUM function’s syntax in Excel?
The SUM function in Excel has a very simple syntax: =SUM(number1, [number2], …). You can include individual numbers, cell references, or ranges within the parentheses to get the total sum.
2. How can I sum only specific values in a column?
You can use the SUMIF function to sum only those cells that meet certain criteria. The syntax for this function is =SUMIF(range, criteria, [sum_range]), allowing for conditional summation based on your needs.
3. What are some effective shortcuts for summing up data?
Excel’s AutoSum feature is one of the quickest ways to sum a column. Just click on the home tab and select the AutoSum button to quickly add up the selected cells. For a keyboard shortcut, press Alt + = to auto-sum the nearest column.
4. Can I create charts directly from sum functions?
Yes! After summing your data in Excel, you can easily select the result and insert charts through the ‘Insert’ menu. This visual representation helps convey your analyses more effectively.
5. Is it possible to sum across multiple worksheets?
Absolutely. You can sum across multiple worksheets by using a formula such as =SUM(Sheet1:Sheet3!A1), which sums the cell A1 in three different tabs named Sheet1, Sheet2, and Sheet3.
6. How to sum non-contiguous cells in Excel?
To sum non-contiguous cells, use the SUM function by specifying each cell or range separated by a comma, for example, =SUM(A1, A3, A5), which will total the values in these specific cells.
7. Where can I find additional resources for using Excel effectively?
There are numerous online courses and tutorials available through platforms like Microsoft’s official learning path, LinkedIn Learning, and other educational sites that cover Excel instructions from beginner to advanced levels.