Understanding Degrees of Freedom in Statistics
In statistics, the concept of degrees of freedom is crucial for interpreting various statistical tests. Knowing how to find degrees of freedom can help in understanding the underlying structure of the data and its implications for statistical significance. In this article, we will explore the fundamentals of calculating degrees of freedom, including the types, formulas, and practical significance in different statistical contexts.
What are Degrees of Freedom?
Degrees of freedom (df) refer to the number of values in a calculation that are free to vary. In simple terms, they indicate the number of independent pieces of information in a given statistical analysis. For example, when estimating a mean, if you have a sample of size n, the degrees of freedom associated with that sample is often n – 1 because one value is constrained by the sample mean. This concept helps in understanding the distribution of statistical estimates. The importance of degrees of freedom cannot be overstated as they play a pivotal role in a variety of statistical tests including t-tests and ANOVA.
Degrees of Freedom in Different Statistical Tests
Degrees of freedom can vary depending on the statistical test being conducted. For instance, in an independent t-test for two samples, the formula for calculating degrees of freedom is: (n1 – 1) + (n2 – 1), where n1 and n2 are the sizes of the two samples. In an ANOVA context, the degrees of freedom between groups is calculated as the number of groups minus one. Within groups, it is calculated as the total number of observations minus the number of groups. This distinction is essential for understanding results and significance levels in different statistical tests.
Practical Examples of Degrees of Freedom
To provide a clearer understanding, let’s consider an example. Suppose you conduct an ANOVA test with three groups of data, each containing 5 observations. The degrees of freedom in ANOVA between groups would be 3 – 1 = 2, and within groups would be 15 – 3 = 12, yielding a total of 14 degrees of freedom. Recognizing how to interpret degrees of freedom in various contexts can enhance your statistical comprehension and help in explaining results more effectively.
Adjusting Degrees of Freedom for Accuracy
In practical statistical applications, adjusting the degrees of freedom can improve the accuracy of model results. For instance, when using complex models or in scenarios involving multiple factors, it’s common to see adjustments made for inflation of degrees of freedom to account for overfitting. This adjustment is crucial for obtaining reliable p-values and improving statistical power.
The Importance of Degrees of Freedom in Statistical Inference
The importance of degrees of freedom in statistics extends to various inferential methods including regression analysis and hypothesis testing. In regression models, for example, the degrees of freedom can influence the tests for the significance of the model coefficients. Understanding the relationship between degrees of freedom and variance also plays a critical role in interpreting the amount of variation explained by a model.
Degrees of Freedom in Regression Analysis
In regression analysis, the degrees of freedom can determine the accuracy and confidence in estimating the coefficients. For simple linear regression, the degrees of freedom are derived from the number of observations minus two (one for the intercept and one for the slope). This calculation allows researchers and analysts to assess the fit of the model while estimating the reliability of predictions. Strong knowledge of how to interpret degrees of freedom in this context is essential for accurate data analysis and reporting.
Degrees of Freedom in Hypothesis Testing
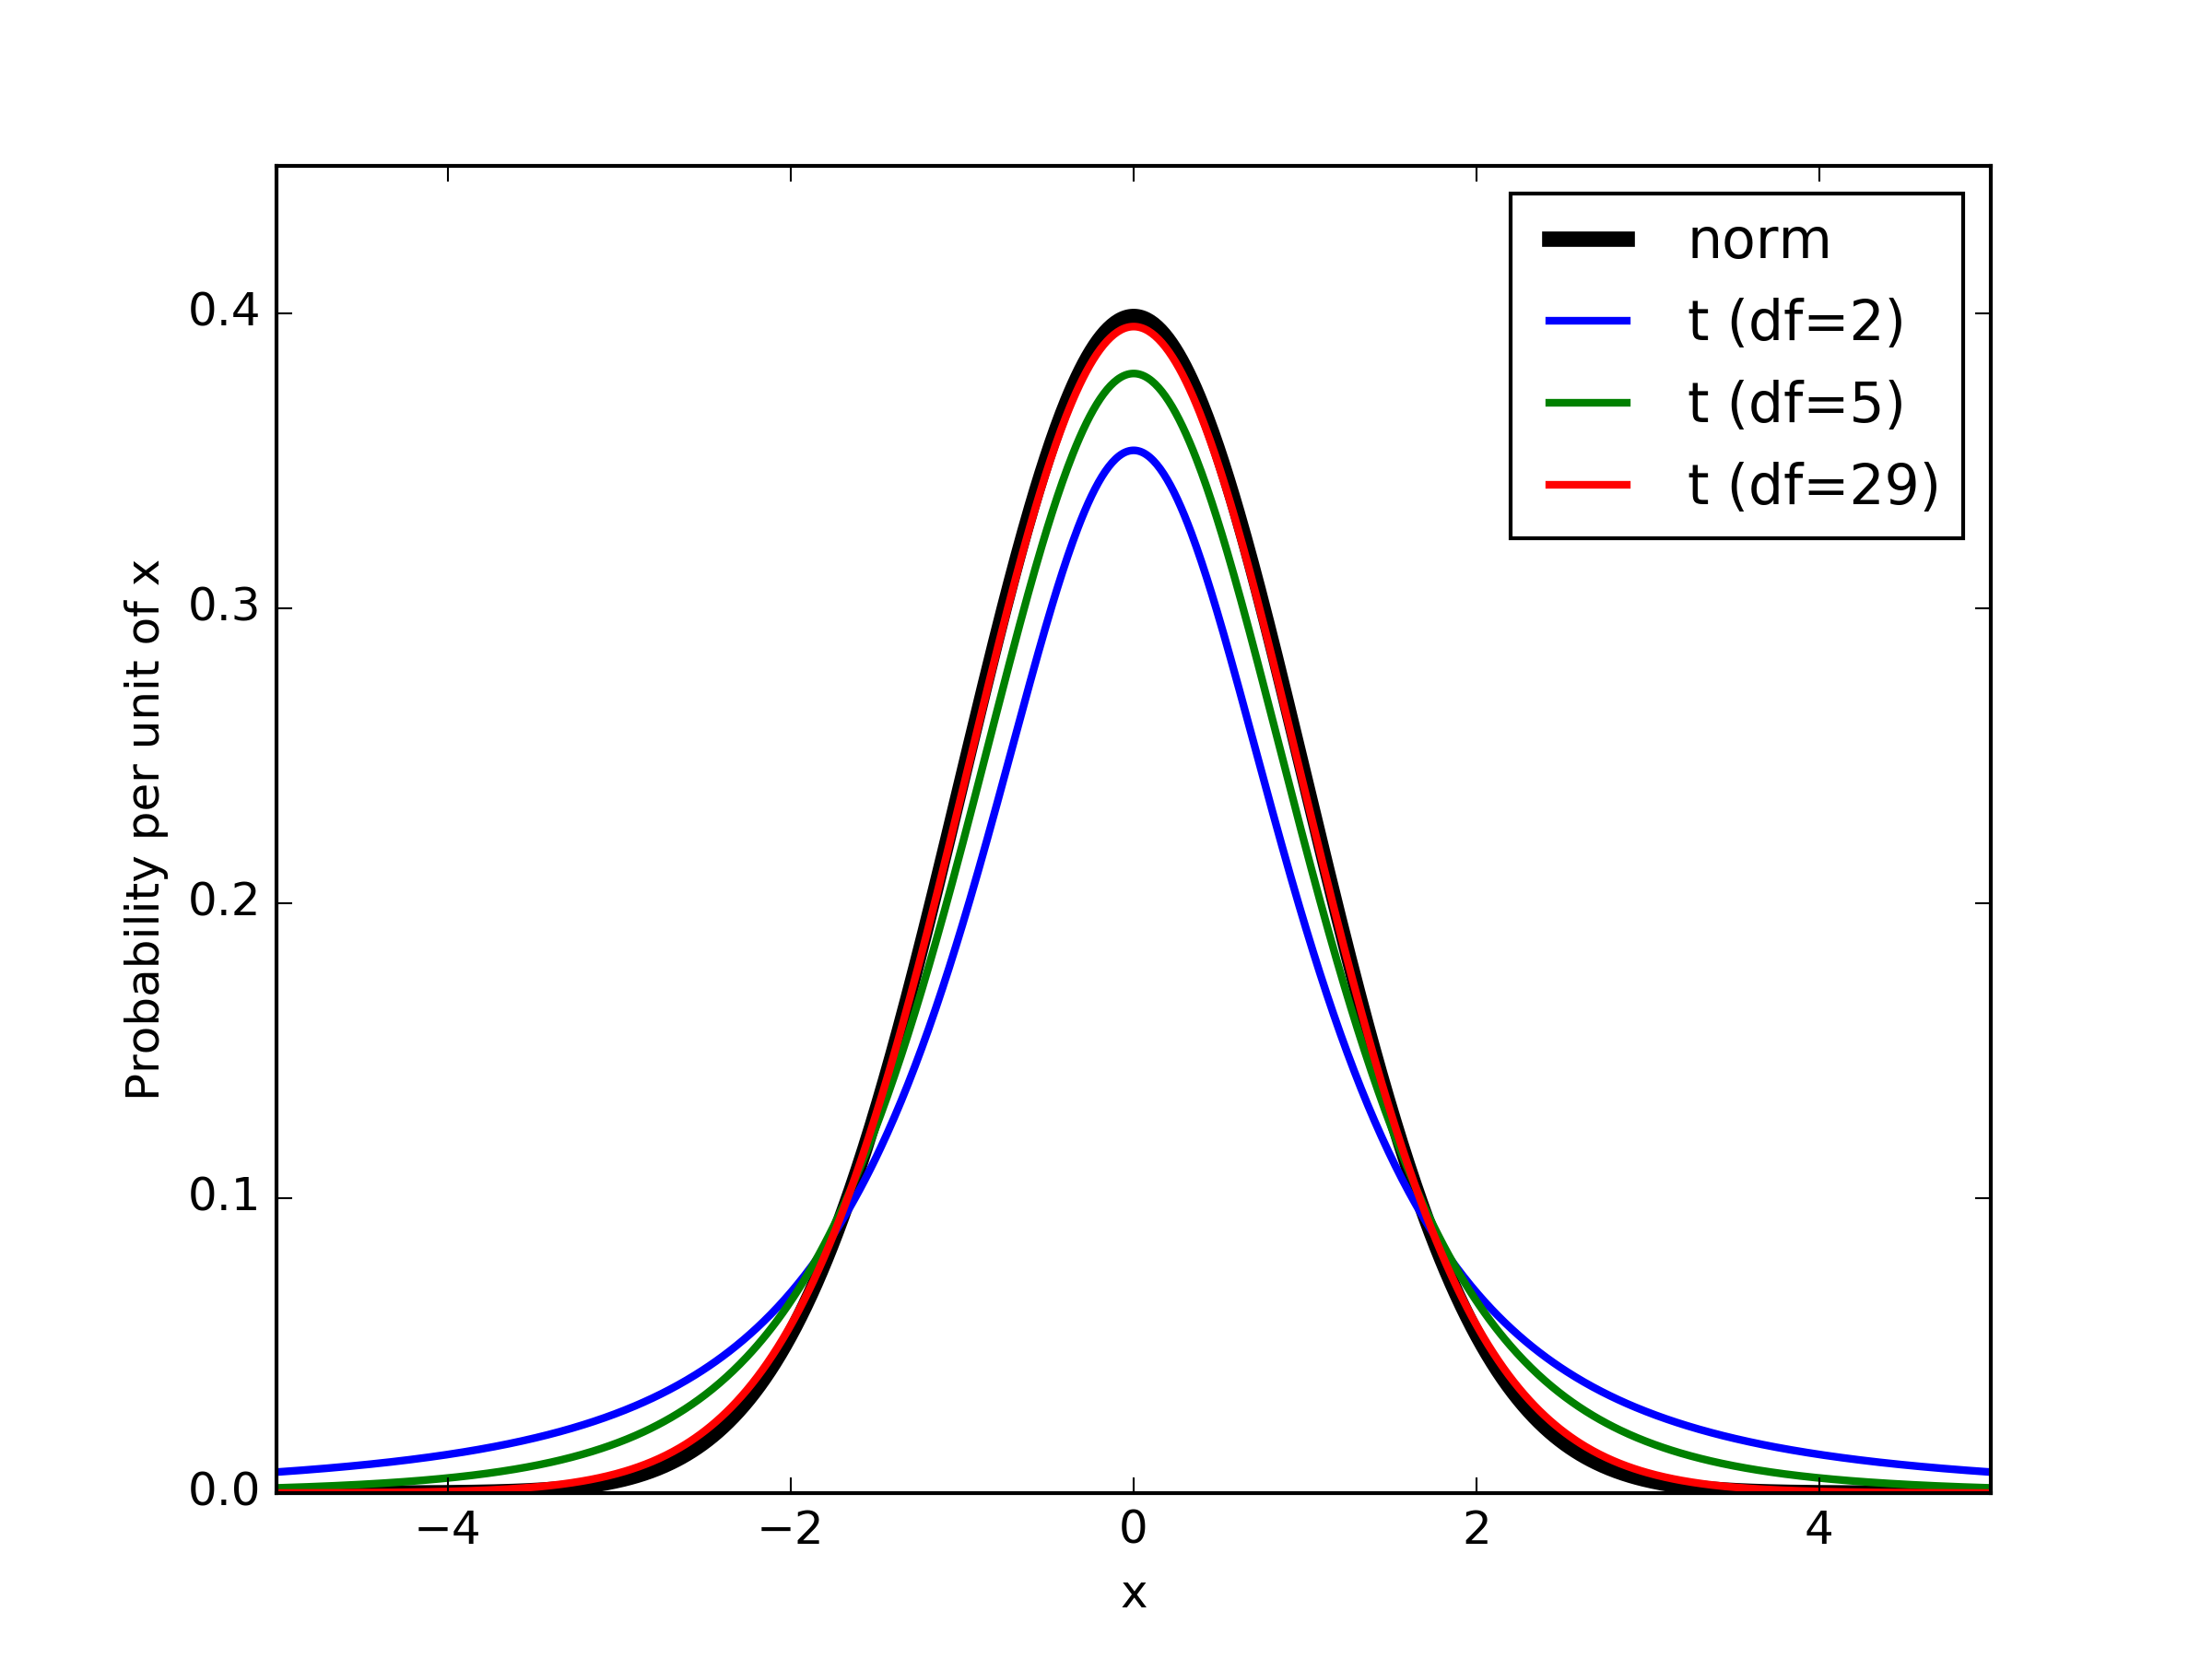
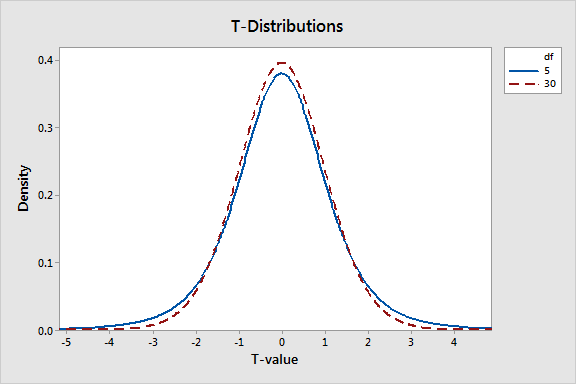
In hypothesis testing, degrees of freedom also determine the distribution used for deriving critical values. Common distributions such as the t-distribution or chi-square distribution depend heavily on degrees of freedom to determine tail probabilities associated with specific statistical tests. As such, correctly identifying and understanding degrees of freedom is key to deriving accurate conclusions from statistical tests, contributing to the robustness of research findings.
Common Mistakes in Calculating Degrees of Freedom
One common mistake in calculating degrees of freedom is neglecting to account for certain constraints or adding extra parameters to the model. For example, failing to reduce the degrees of freedom when estimating multiple parameters can lead to incorrect p-values and misinterpretation of the results. It’s essential to carefully consider and apply the relevant formulas in context to avoid these errors and ensure valid statistical inferences.
Application of Degrees of Freedom in Machine Learning
With the rise of machine learning, understanding degrees of freedom in machine learning has become increasingly important. Here, degrees of freedom can relate to the flexibility of a statistical model or algorithm, providing insights into whether a model is overfitting or underfitting data. The principles observed within statistical frameworks extend into machine learning, impacting algorithms’ effectiveness in prediction tasks.
Degrees of Freedom in Complex Models
When designing complex models, such as multi-layer neural networks or ensemble methods, it’s crucial to manage the degrees of freedom to ensure model robustness. Each layer or additional parameter adds complexity to the model, which can affect generalization to unseen data. The balance between model complexity, degrees of freedom, and sample size is critical, guiding practitioners in achieving optimal model performance.
Significance of Degrees of Freedom on Statistical Power
The influence of degrees of freedom on statistical power is particularly notable in the context of sample size calculations. Greater degrees of freedom often lead to higher statistical power, allowing researchers to detect true effects with higher reliability. Understanding this relationship fosters informed decision-making in study design, ensuring that sample size adequately accounts for required degrees of freedom to detect significant findings.
Degrees of Freedom in Data Analysis
Effective data analysis relies on sound statistical principles including an understanding of degrees of freedom. It guides data validation steps, informs model selection, and assists in interpreting results accurately. Grasping the concept of degrees of freedom equips analysts and researchers to approach statistical tasks with confidence, leading to more credible and reproducible outcomes.
Conclusion
Understanding degrees of freedom is fundamental in the field of statistics. By recognizing their significance, different types in tests, and applications among varied models, statisticians and data analysts can improve the interpretation of their results substantially. A solid grasp of how to calculate and use degrees of freedom allows for deeper insights into data and fosters clearer communication of findings.
FAQ
1. What are degrees of freedom in statistics?
Degrees of freedom refer to the number of independent values in a calculation that can vary. They play a pivotal role in hypothesis testing and statistical inference by influencing the distributions used in statistical tests.
2. How do you calculate degrees of freedom for ANOVA?
In ANOVA, the formula for degrees of freedom between groups is calculated as the number of groups minus one (k – 1). For within groups, it is the total number of observations minus the number of groups (N – k).
3. Why are degrees of freedom important in regression analysis?
In regression analysis, degrees of freedom help assess the significance of regression coefficients. They are crucial in determining the reliability of the model and the strength of the relationships identified in the data.
4. What are common mistakes in finding degrees of freedom?
Common mistakes include failing to adjust degrees of freedom when estimating multiple parameters, leading to invalid p-values and distortions in test results. It’s essential to follow the correct formulas and consider data constraints carefully.
5. How do degrees of freedom impact statistical power?
The degrees of freedom affect statistical power, with higher degrees typically correlated with greater power to detect true effects. Balancing degrees of freedom with sample size is key to ensuring reliable test results.
6. How do degrees of freedom relate to sample size?
As sample size increases, degrees of freedom generally increase as well, which can enhance the robustness of statistical estimates and the ability to generalize findings. This relationship is vital in both experimental and observational studies.
7. What types of degrees of freedom exist in statistical testing?
Different types of degrees of freedom exist based on the context, including those used in t-tests, ANOVA, regression analysis, and chi-square tests. Understanding these varieties is crucial for accurate statistical modeling.